Air or Hydro Bitcoin ASIC in 2026: Margin and Payback by Budget
With a $11,000 hardware budget, Startmining’s pre-tax prices at the end of September let you compare three S21+ Hydro units with two S21e XP Hydro units. At $0.07/kWh, both configurations leave almost the same margin after electricity and pool fees: about $430 and $426 per month. Yet the first draws 16.11 kW, against 11.18 kW for the second.
Computing power, efficiency and purchase price do not always produce the same ranking. Let’s compare the ASICs, the configurations a given budget can buy, and how well they hold up when the kWh price rises or mining revenue falls.
We compare the last three Air and Hydro generations shown in the BITMAIN charts — S21, S21 XP and S23 — through their closest commercial equivalents in Startmining’s end-of-September 2026 selection. All six models use the prices and specifications provided on September 30, 2026, with fixed network assumptions detailed below.
Efficiency, margin and payback: three different answers
Hashrate, in TH/s, measures computing power. kW indicates the electrical power drawn. Efficiency, in J/TH, links the two: the lower it is, the less energy is needed to deliver the same amount of computation.
Operating margin is what remains after running costs. Here, we first calculate a partial margin after electricity and pool fees. Maintenance, repairs or additional hosting fees must then be deducted where they apply.
Economic payback means recovering the capital invested through the cash flows generated. It differs from accounting depreciation and from a return expressed as a percentage. An ASIC can show a positive margin without paying back its purchase price over its operating life.
To place these models in the wider market, read our guide to understanding Bitcoin ASIC generations.
Air ASICs: S21 Pro, S21 XP and S23
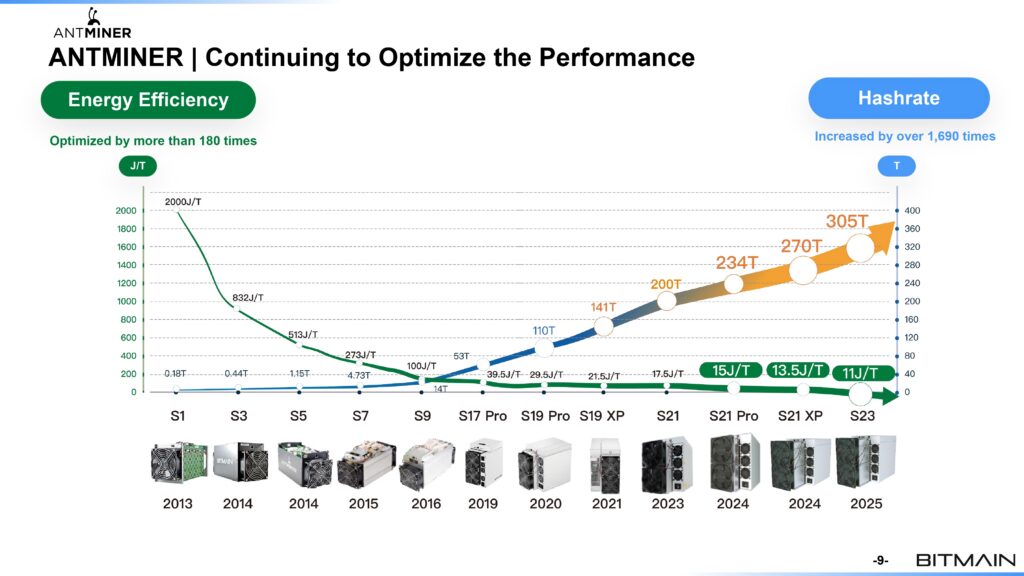
BITMAIN presentation, page 9: evolution of the Air generations. The table lists the three generations we selected with their commercial equivalents chosen at the end of September 2026.
| Selected model | TH/s | Rated power | J/TH ≈ | Startmining price excl. tax | Price per TH/s excl. tax |
|---|---|---|---|---|---|
| S21 Pro Air | 245 | 3.68 kW | 15.0 | $2,604.77 | $10.63 |
| S21 XP Air | 270 | 3.65 kW | 13.5 | $3,654.96 | $13.54 |
| S23 Air | 305 | 3.36 kW | 11.0 | $10,073.20 | $33.03 |
Prices are in US dollars, excluding tax. The price per TH/s is the ASIC’s pre-tax price divided by its hashrate, rounded to two decimals.
In Air, each efficiency gain requires more capital here. The energy savings therefore have to be weighed against the extra purchase cost.
Hydro ASICs: S21+, S21e XP and S23
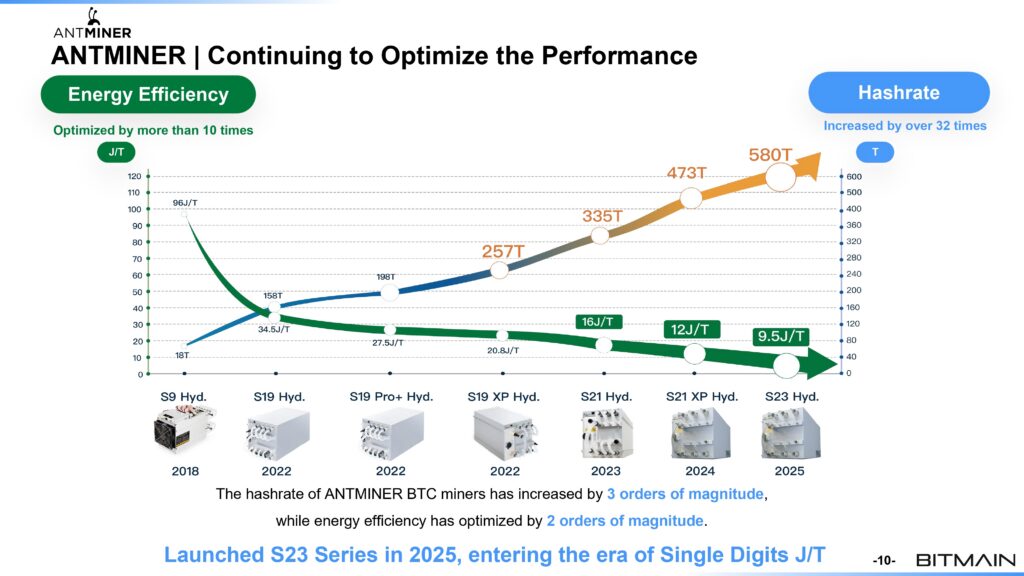
BITMAIN presentation, page 10: evolution of the Hydro generations. The table shows the commercial equivalents of the three selected generations. The chart’s scales are specific to this range.
| Selected model | TH/s | Rated power | J/TH ≈ | Startmining price excl. tax | Price per TH/s excl. tax |
|---|---|---|---|---|---|
| S21+ Hydro | 358 | 5.37 kW | 15.0 | $3,001.45 | $8.38 |
| S21e XP Hydro | 430 | 5.59 kW | 13.0 | $4,612.24 | $10.73 |
| S23 Hydro | 580 | 5.51 kW | 9.5 | $16,781.60 | $28.93 |
Hydro refers to liquid cooling, not to where the electricity comes from. A Hydro ASIC must be installed on infrastructure compatible with its power supply and cooling loop. Our guide to Air and Hydro cooling covers these constraints in detail.
The calculations use the rounded power figures provided by Startmining; J/TH values are derived from them to one decimal. These are reference specifications, not on-site measurements. The quote should state applicable taxes and duties, included services and availability.
Air vs Hydro: comparing the right models
The three pairs below compare the purchase options within each generation. Their results reflect all the selected specifications: hashrate, electrical power, price and cooling.
S21 Pro Air vs S21+ Hydro: similar efficiency
Both ASICs sit around 15 J/TH. The S21+ Hydro delivers about 46% more hashrate, for a comparable increase in electrical power. Efficiency is therefore similar. The S21 Pro keeps the initial outlay down; the S21+ packs more computing power per unit and has the lowest purchase price per TH/s, provided the required power is available.
S21 XP Air vs S21e XP Hydro: more computing power per unit
The S21e XP Hydro, at 430 TH/s and 5.59 kW, delivers about 59% more hashrate for 53% more electrical power than the 270 TH/s S21 XP Air. Its efficiency is slightly better; its total bill per ASIC is higher.
S23 Air vs S23 Hydro: efficiency against capital committed
The S23 Hydro has the best efficiency and the highest price of the six variants. Its appeal depends on the configurations your budget can cover and the kW available on site.
What monthly margin under the same assumptions?
We compare the models in professional hosting under shared assumptions. Hashprice measures the expected revenue per unit of computing power; it depends mainly on the BTC price, difficulty and network rewards. It is expressed here in dollars per PH/s per day: 1 PH/s = 1,000 TH/s.
| Parameter | Shared baseline |
|---|---|
| Simulated gross hashprice | $40.04 per PH/s per day |
| BTC price used to convert electricity cost per BTC | $84,371 — assumption |
| Simulation framework | September 30, 2026; fixed parameters to compare the ASICs |
| Period and uptime | 30 days; 95% uptime, shared assumption |
| Pool fees | 2% of gross revenue, assumption |
| Electricity | $0.07/kWh baseline; tested at $0.05 and $0.10/kWh |
| Simulated billing | Rated power × running time; no contractual minimum added |
Hashprice and the BTC price are fixed comparison assumptions. Maintenance, fixed fees and separately billed ancillary costs, which may differ between Air and Hydro, still have to be deducted from the margin. The kWh prices tested are not hosting offers.
Example: the S21 XP Air generates about $308 in gross revenue in this scenario. After about $6 in pool fees and $175 in electricity, $127 per month remains before other costs. The table shows revenue directly after the 2% pool fee.
Amounts rounded to the dollar after calculation. Electricity cost per BTC uses estimated production net of pool fees. It excludes the ASIC purchase and other costs: it is not the full production cost.
| One ASIC | Revenue after pool/month | Electricity/month | Partial margin/month | Electricity per BTC |
|---|---|---|---|---|
| S21 Pro Air | $274 | $176 | $98 | $54,258 |
| S21+ Hydro | $400 | $257 | $143 | $54,184 |
| S21 XP Air | $302 | $175 | $127 | $48,833 |
| S21e XP Hydro | $481 | $268 | $213 | $46,960 |
| S23 Air | $341 | $161 | $180 | $39,794 |
| S23 Hydro | $649 | $264 | $385 | $34,317 |
The S23 Hydro earns the most per unit; the ranking at equal budget remains to be established.
Payback: comparing capital with margin without predicting a date
These static ratios do not predict a payback date. They divide the ASIC’s pre-tax price by its margin after electricity and pool fees, with all parameters held constant.
Even the shortest ratio, about 21 months, would run past spring 2028 for a start at the end of September 2026. The next halving is expected around then: the block subsidy will be cut in half. None of the ratios below models that change. Total revenue will also depend on the BTC price, difficulty and transaction fees.
| Model | ASIC price excl. tax ÷ monthly partial margin |
|---|---|
| S21 Pro Air | 27 months |
| S21+ Hydro | 21 months |
| S21 XP Air | 29 months |
| S21e XP Hydro | 22 months |
| S23 Air | 56 months |
| S23 Hydro | 44 months |
Better efficiency is not enough to recover capital faster. To estimate payback over time, you need to include the full upfront cost, commissioning, and variable revenue and costs. Any resale value is excluded here.
What can $5,000, $11,000 or $21,000 buy?
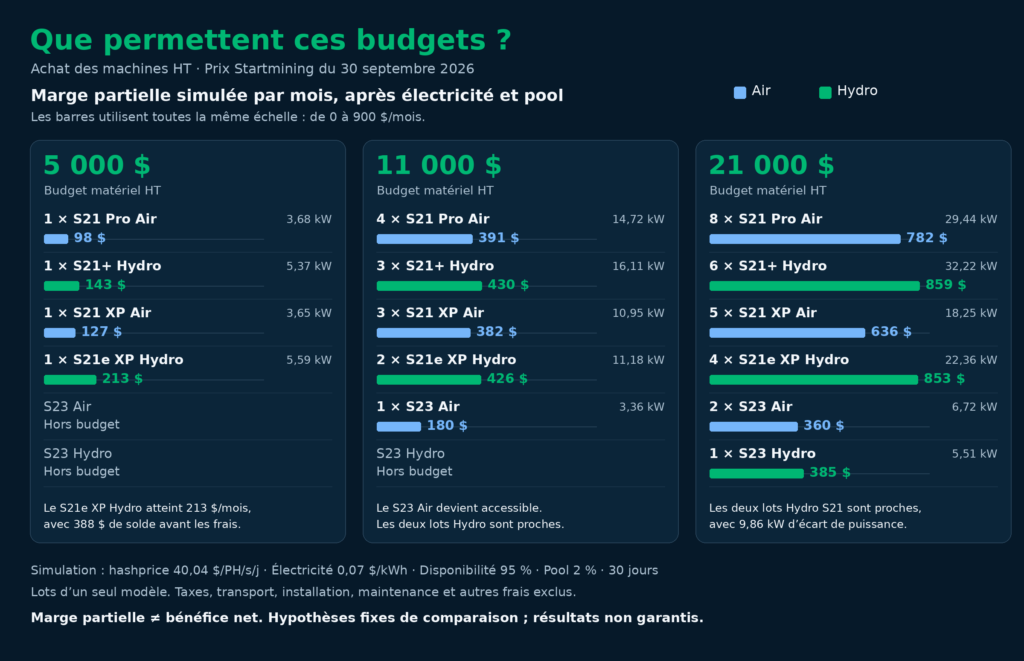
These budgets cover the purchase of the ASICs at the pre-tax prices provided. Additional items on the quote — shipping, taxes, installation or deposit — must be funded from the remaining balance or reduce the quantity purchased. Keep a reserve as well.
Each row uses a single model; mixes are not optimized and the remaining balance generates no revenue. Monthly margins are calculated at $0.07/kWh, after pool fees and electricity.
With a $5,000 hardware budget
| Configuration | Total power | ASIC purchase excl. tax | Balance before taxes and other fees | Partial margin/month |
|---|---|---|---|---|
| 1 × S21 Pro Air | 3.68 kW | $2,604.77 | $2,395.23 | $98 |
| 1 × S21+ Hydro | 5.37 kW | $3,001.45 | $1,998.55 | $143 |
| 1 × S21 XP Air | 3.65 kW | $3,654.96 | $1,345.04 | $127 |
| 1 × S21e XP Hydro | 5.59 kW | $4,612.24 | $387.76 | $213 |
The S23 models remain out of budget. The S21e XP Hydro delivers the highest partial margin, but leaves only $387.76 for fees and reserve. The S21 Pro preserves more cash.
With an $11,000 hardware budget
| Configuration | Total power | ASIC purchase excl. tax | Balance before taxes and other fees | Partial margin/month |
|---|---|---|---|---|
| 4 × S21 Pro Air | 14.72 kW | $10,419.08 | $580.92 | $391 |
| 3 × S21+ Hydro | 16.11 kW | $9,004.35 | $1,995.65 | $430 |
| 3 × S21 XP Air | 10.95 kW | $10,964.88 | $35.12 | $382 |
| 2 × S21e XP Hydro | 11.18 kW | $9,224.48 | $1,775.52 | $426 |
| 1 × S23 Air | 3.36 kW | $10,073.20 | $926.80 | $180 |
The S23 Air comes within reach and keeps the required power down to 3.36 kW. The S21 Air batches deliver more margin, but the three XP units leave only $35.12: their purchase takes up almost the entire budget.
In Hydro, the S21+ and eXP batches are almost tied on margin, with a 4.93 kW gap. Site-specific fees may be enough to reverse their ranking.
With a $21,000 hardware budget
| Configuration | Total power | ASIC purchase excl. tax | Balance before taxes and other fees | Partial margin/month |
|---|---|---|---|---|
| 8 × S21 Pro Air | 29.44 kW | $20,838.16 | $161.84 | $782 |
| 6 × S21+ Hydro | 32.22 kW | $18,008.70 | $2,991.30 | $859 |
| 5 × S21 XP Air | 18.25 kW | $18,274.80 | $2,725.20 | $636 |
| 4 × S21e XP Hydro | 22.36 kW | $18,448.96 | $2,551.04 | $853 |
| 2 × S23 Air | 6.72 kW | $20,146.40 | $853.60 | $360 |
| 1 × S23 Hydro | 5.51 kW | $16,781.60 | $4,218.40 | $385 |
The S21+ and eXP Hydro batches stay close on margin, with a 9.86 kW gap. Deploying them therefore requires different electrical capacity.
The two S23 Air vs one S23 Hydro matchup shows another trade-off: the Hydro earns about $385 per month, against $360 for the two Air units, while tying up less capital and power. This comparison still needs to factor in the infrastructure and service costs specific to each option.
You can test your configuration in the Startmining simulator, then check the results against the clauses of your hosting contract.
Can the kWh price reverse the ranking?
Let’s take the configurations from the $11,000 budget again, without changing quantities or network revenue. Here is their monthly partial margin at three electricity prices:
| Configuration — $11,000 budget | $0.05/kWh | $0.07/kWh | $0.10/kWh |
|---|---|---|---|
| 4 × S21 Pro Air | $593 | $391 | $89 |
| 3 × S21+ Hydro | $650 | $430 | $99 |
| 3 × S21 XP Air | $531 | $382 | $157 |
| 2 × S21e XP Hydro | $579 | $426 | $197 |
| 1 × S23 Air | $226 | $180 | $111 |
At $0.05/kWh, the three S21+ Hydro units pull ahead of the two S21e XP Hydro units; at $0.10/kWh, the order flips. The crossover point is around $0.071/kWh: below it, the S21+ batch earns more; above it, the eXP batch takes the lead.
In Air, the four S21 Pro and the three S21 XP swap places around $0.074/kWh. The Pro units benefit from cheaper electricity; the XP units hold up better when it rises.
These benchmarks are calculated for the $11,000 batches, with the selected network assumptions and before other costs. They mark the point where two configurations earn the same margin, not the price at which their margin drops to zero.
What if mining revenue falls?
For the batches available with $21,000, let’s test a −30% and +30% hashprice at $0.07/kWh. Quantities and other parameters stay fixed. The table shows the batch’s monthly partial margin; these scenarios are not forecasts.
| Configuration — $21,000 budget | Hashprice −30% | Fixed baseline | Hashprice +30% |
|---|---|---|---|
| 8 × S21 Pro Air | $125 | $782 | $1,440 |
| 6 × S21+ Hydro | $139 | $859 | $1,580 |
| 5 × S21 XP Air | $183 | $636 | $1,089 |
| 4 × S21e XP Hydro | $276 | $853 | $1,430 |
| 2 × S23 Air | $156 | $360 | $565 |
| 1 × S23 Hydro | $190 | $385 | $579 |
A 30% drop in revenue can cut the margin far more sharply. For the six S21+ Hydro units, it falls from $859 to $139 per month, about −84%: the electricity bill stays the same in this scenario.
The four S21e XP Hydro units keep the highest partial margin of the six batches in the downside scenario. Other costs may still reduce that balance or turn the full cash flow negative.
If the cash flow is zero or negative, it cannot pay back the purchase for as long as those conditions last. For more on the network variables, read our analysis of the factors behind mining profitability.
Choosing a configuration that fits your budget and your site
Among the configurations studied, the choice depends on your main constraint:
- Keeping the initial outlay low: the S21 Pro Air requires the least capital and keeps the most cash within the $5,000 budget.
- Maximizing margin in the central scenario: the S21e XP Hydro comes out on top at $5,000. At $11,000 and $21,000, the S21+ Hydro batches edge slightly ahead of the eXP batches, but need more power.
- Working within limited electrical capacity: at $11,000, one S23 Air draws 3.36 kW; at $21,000, one S23 Hydro earns more than two S23 Air while using less power and capital.
- Coping with a higher kWh price: compare the eXP batches with the S21+ in Hydro, and the XP with the Pro in Air, using the crossover prices. The S23 Hydro’s better efficiency should also be weighed against its purchase price.
- Stress-testing a revenue drop: the four S21e XP Hydro units keep the highest partial margin in the $21,000 table when hashprice falls by 30%.
Check this choice against the full quote: stock, start date, fees during downtime and the reserve you need. Then simulate your budget and your kWh price and ask for the hosting terms compatible with your ASIC.
Method and sources
For an ASIC with H TH/s and P kW, over 30 days at 95% uptime:
- Gross revenue = 40.04 × H / 1,000 × 30 × 0.95.
- Pool fees = gross revenue × 2%.
- Energy = P × 24 × 30 × 0.95, in kWh.
- Partial margin = gross revenue − pool fees − energy × kWh price.
- Full cash flow = partial margin − other applicable costs.
- Estimated net production in BTC = revenue after pool / 84,371; indicative conversion based on the fixed baseline.
- Electricity cost per BTC = electricity bill / estimated net production.
- Quantity in the table = integer part of the hardware budget / ASIC price; the batch’s power and cash flows are multiplied by this quantity.
- Purchase price per TH/s excl. tax = ASIC price excl. tax / hashrate in TH/s.
- Static ratio = ASIC price excl. tax / monthly partial margin, only when the latter is positive.
- Crossover price between two batches = difference in their revenue after pool / difference in their monthly consumption in kWh. Other costs are excluded.
Prices, hashrates and kW come from Startmining information dated September 30, 2026. The calculations use kW to two decimals; prices and balances are kept to the cent and monthly results are shown to the dollar, with no intermediate rounding. No revenue comes from an assumed rise in retained BTC, and no resale value is added.
The charts come from a BITMAIN presentation. Additional references: S21 Pro user guide, 245/234/220 TH/s variants, S21+ Hydro, S21e XP Hydro 430 TH/s and Luxor’s definition of hashprice. The network values in this article are fixed comparison assumptions; market data can be checked on Hashrate Index.
Passez à l'action
Ready to mine Bitcoin with Startmining?
Browse our ASIC shop or simulate your profitability in real time.